A Simple Implementation of Support Vector Machine (SVM)
In this note, we implement the support vector machine algorithm to recognize handwritten digits. The MNIST dataset available in Keras is in tuple format. We fetch the training set and test set from this dataset, visualize some observations, and unroll the 2-D pixel values into 1-D arrays. Then, we train the SVM classifier with default hyperparameters on the training set, use the fitted model to predict on the test set, and evaluate the performance in terms of accuracy.
○ Contents
○ Data
There are multiple ways to load the MNIST dataset. The keras.datasets module provides it readily. We use this to load the data.
from keras.datasets import mnist
data = mnist.load_data()
A good place to understand the data is the Keras documentation on it. Taking a quick look at the documentation page, we understand that the loaded data contains sixty thousand \(28 \times 28\) grayscale images of the \(10\) digits, along with a test set of ten thousand images.
We also see from the documentation that the data is in the format of a tuple of NumPy arrays: (X_train, y_train), (X_test, y_test).
(X_train, y_train), (X_test, y_test) = data
We check the shape of the arrays.

○ Visualization
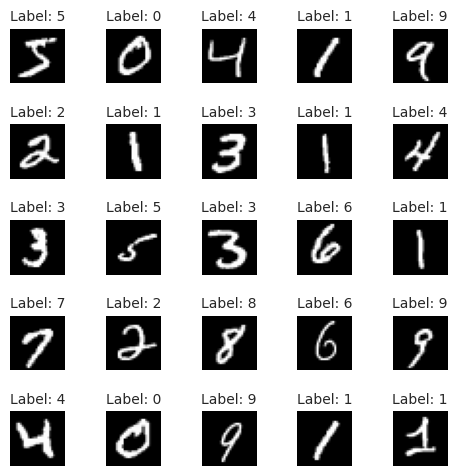
To visualize the handwritten digits from the raw data, we use the imshow function from the matplotlib.pyplot module.
import matplotlib.pyplot as plt
num_images = 25
fig, axes = plt.subplots(5, 5, figsize = (5, 5))
axes = axes.flatten()
for i in range(num_images):
    axes[i].imshow(X_train[i], cmap = 'gray')
    axes[i].axis('off')
    axes[i].set_title(f"Label: {y_train[i]}", fontsize = 10)
plt.tight_layout()
plt.show()

○ Unrolling
To train an SVM classifier on the data, we need to unroll the pixel values to a one-dimensional array. For this reason, we reshape X_train and X_test such that the \(28 \times 28\)
greyscale pixel values corresponding to each observation becomes an array of \(784\)
values.
import numpy as np
X_train_unrolled = X_train.reshape(X_train.shape[0], np.prod(X_train.shape[1:]))
X_test_unrolled = X_test.reshape(X_test.shape[0], np.prod(X_test.shape[1:]))
We check the shape of X_train_unrolled and X_test_unrolled.

○ Training and Inference
We import the SVM classifier from Scikit-learn. See the documentation page for more details.
from sklearn import svm
clf = svm.SVC()
Note: If we try to train the model on (X_train, y_train), we would get the following error message:
ValueError: Found array with dim 3. SVC expected <= 2.
Now, we train the model on (X_train_unrolled, y_train).
clf.fit(X_train_unrolled, y_train)
Next, we use the fitted model to predict the test labels based on the unrolled test features X_test_unrolled.
y_pred = clf.predict(X_test_unrolled)
○ Evaluation
The sklearn.metrics module provides a number of measures to evaluate models. We import the accuracy_score metric and feed the true test labels y_test and the predicted test labels y_pred to it.
from sklearn.metrics import accuracy_score
accuracy_score(y_test, y_pred)
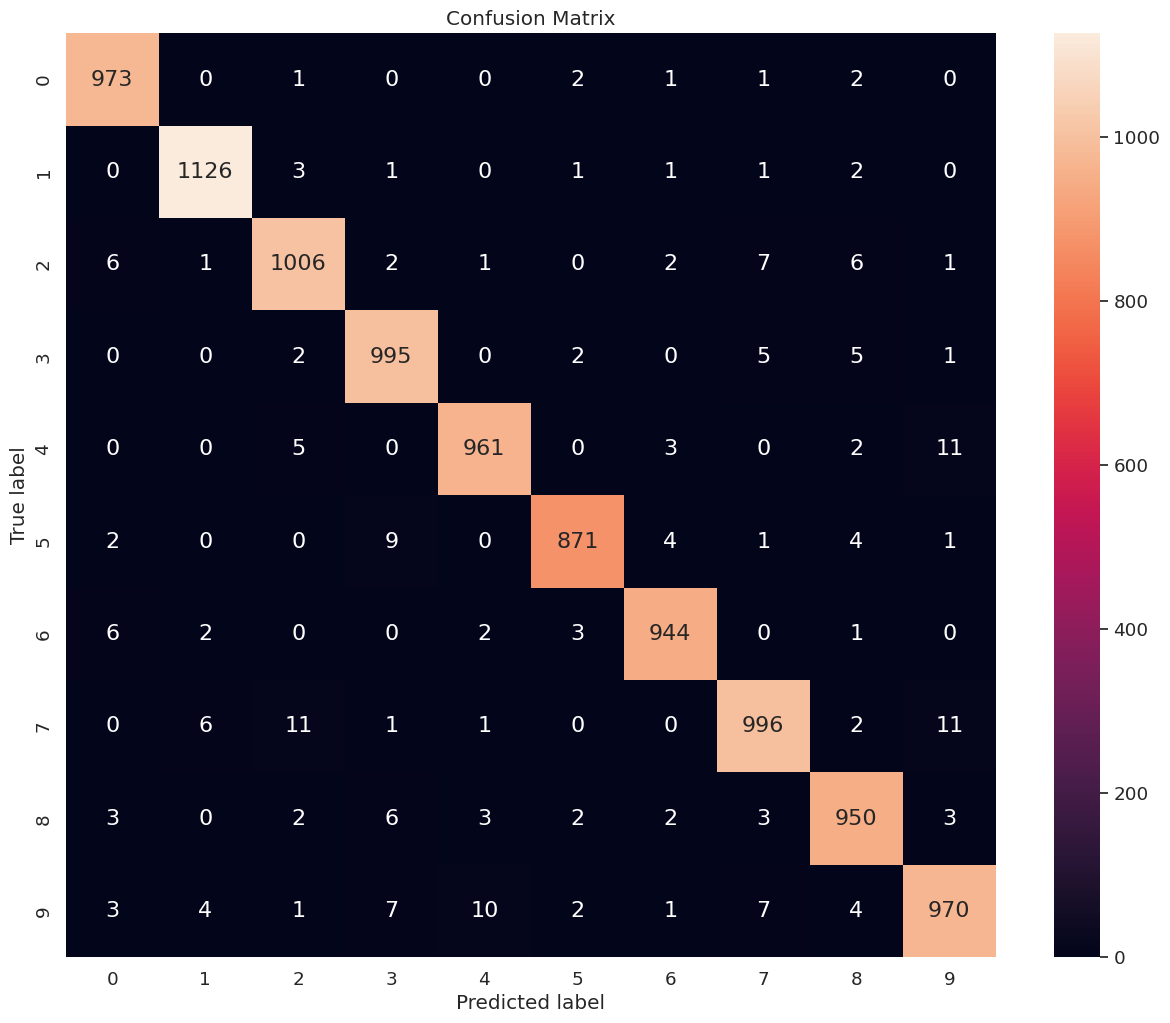
We obtain an accuracy score of \(0.9792\). Next, we compute and print the confusion matrix depicting the model performance on each class.
import pandas as pd
import seaborn as sns
from sklearn import metrics
def conf_mat(y_test, y_pred, num_class, figsize = (10, 8), font_scale = 1.2, annot_kws_size = 16):
    class_names = np.arange(num_class)
    tick_marks_y = np.arange(num_class) + 0.5
    tick_marks_x = np.arange(num_class) + 0.5
    confusion_matrix = metrics.confusion_matrix(y_test, y_pred)
    confusion_matrix_df = pd.DataFrame(confusion_matrix, range(num_class), range(num_class))
    plt.figure(figsize = figsize)
    sns.set(font_scale = font_scale) # label size
    plt.title("Confusion Matrix")
    sns.heatmap(confusion_matrix_df, annot = True, annot_kws = {"size": annot_kws_size}, fmt = 'd') # font size
    plt.yticks(tick_marks_y, class_names, rotation = 'vertical')
    plt.xticks(tick_marks_x, class_names, rotation = 'horizontal')
    plt.ylabel('True label')
    plt.xlabel('Predicted label')
    plt.grid(False)
    plt.show()

conf_mat(y_test, y_pred, num_class = 10, figsize = (15, 12), font_scale = 1.2, annot_kws_size = 16)

○ References
- Accuracy score documentation
- Confusion matrix
- imshow function
- Keras datasets
- MNIST digits classification dataset
- Pyplot module
- Scikit-learn
- Scikit-learn metrics
- Support Vector Classification documentation